


THE RHYME OF 1929
A Comparative Framework: 1927–1932 and 2024–2026
Structure Before Sophistication — July 2026
Not investment, legal, or financial advice.
Everyone wants to know if 2026 is 1929. It’s the wrong question, and asking it wrong is how you end up either dismissing the comparison entirely or panicking over it. The better question is whether 2026 has assembled the same conditions that made 1929 dangerous — and if so, which ones, and how many of the ones that made 1929 catastrophic.
Here’s the answer up front, because I don’t believe in burying a thesis under three thousand words of throat-clearing: 1929 was two events stacked on top of each other, not one. There was a bubble. And then there was a policy failure that turned a bad correction into the Great Depression. 2026 unmistakably has the first. The second is still a choice nobody has made yet. That asymmetry is the whole argument. Everything below is just showing my work.
The way to test that properly is boring on purpose: figure out what actually happened between 1927 and 1932, figure out where we actually stand today, put the two side by side without flinching from either the parts that rhyme or the parts that don’t, and then say — in advance — what evidence would prove this wrong. A framework that can’t tell you what would falsify it isn’t a framework. It’s a vibe.
What Actually Happened, 1927–1932
The Dow roughly doubled between early 1928 and its peak of 381.17 on September 3, 1929. It was a narrow, narrative-driven rally — radio, aviation, automobiles, and electric-utility holding companies were the era’s glamour trade. RCA, the definitive tech stock of the age, rose several-fold in under two years on the promise of a genuinely transformative technology: broadcasting. It then lost roughly 98% of its value peak to trough. Worth sitting with that for a second — the technology was real. The price was not. Those are two different claims, and 1929 is the clearest historical case of investors conflating them.
What made the boom dangerous wasn’t the story — it was the plumbing underneath it. Investors could buy stock on margin of roughly 10%, and brokers’ loans reached about $8.5 billion by late 1929, somewhere around 8 to 10% of U.S. GDP, much of it funded not by banks but by corporations and foreign lenders chasing call-loan rates. That’s an early shadow-credit channel, and it matters later. Investment trusts — the era’s structured products — pyramided leverage on leverage, trusts holding trusts holding margined stock, with utility holding companies (Samuel Insull’s empire being the textbook case) adding another layer of debt at every tier. By September 1929 the Shiller CAPE ratio hit roughly 32 to 33 — at the time, the highest reading ever recorded, about double its long-run median.
The Fed had been tightening since 1928 specifically to choke off the speculation, pushing the discount rate to 6% by August 1929. The market broke on October 24 — Black Thursday — and came apart on October 28 and 29, down roughly 13% and 12% on consecutive days. Mechanically, it was the margin structure doing exactly what margin structures do: falling prices triggered calls, calls triggered forced selling, forced selling triggered more falling prices. The call-loan market evaporated fastest of all, because the corporations and foreign lenders funding it had no relationship reason to stick around once the trend turned.
Here’s the part almost everyone gets wrong: the October crash did not, by itself, cause the Great Depression. By April 1930 the Dow had clawed back nearly half its losses. What turned a severe correction into a systemic collapse was three separate policy failures, stacked on top of each other over the following two years.
• Trade. The Smoot-Hawley Tariff Act, signed in June 1930 over the objection of more than a thousand economists who petitioned against it, triggered retaliatory tariffs around the world. Global trade contracted by roughly two-thirds between 1929 and 1934.
• Money and banking. The Fed allowed the money supply to shrink by about a third and largely stood by through repeated banking panics. Roughly 9,000 U.S. banks failed between 1930 and 1933. There was no deposit insurance yet, so depositor losses were total — and every panic rationally fed the next one.
• The gold standard. Fixed exchange rates transmitted the deflation internationally. Countries defending their gold parities were forced to tighten into the collapse rather than ease. Britain left gold in September 1931; the countries that abandoned it earliest recovered soonest, which is about as clean a natural experiment as economic history offers.
The Dow bottomed on July 8, 1932, at 41.22 — down 89% from the peak. U.S. output fell roughly 30%. Unemployment hit roughly 25% by 1933. Politically, the depression became the incubator for the entire following decade: protectionism hardened into autarky, democracies buckled under the strain, and the 1930s ended in world war. That lag is worth remembering when we get to scenarios — the worst political consequences of 1929 arrived five to ten years after the financial event, not immediately after it.
Where We Actually Stand in Mid-2026
Now the other half of the comparison. Where does mid-2026 actually sit against that record, r
Valuation. Start with valuation, because it’s the simplest and the starkest. The Shiller CAPE ratio sits at roughly 41 to 42 as of mid-July 2026. The all-time high is 44.2, set in December 1999; the long-run median since 1881 is 16.1. That means today’s market is already more stretched than 1929 ever was — `` peaked around 32 to 33 in September of that year — and has only been matched once in history, in the closing months of the dot-com bubble.
Concentration. The top ten stocks in the S&P 500 now represent roughly 35% of the index’s total market capitalization, versus about 25% at the 2000 peak. Apollo’s chief economist Torsten Sløk has a good name for this: the diversification illusion. Buy the index today and you think you own five hundred businesses. In practice you own one thesis — AI infrastructure monetization. The genuine mitigating factor is that the Magnificent Seven’s net margins run above 25%, against roughly 13% for the index as a whole. These are real, cash-generative businesses in a way RCA’s holding-company pyramids and 2000’s revenue-free dot-coms were not. That distinction matters, and I’ll come back to it.
Leverage. This is where it gets genuinely uncomfortable. Margin debt crossed $1.1 trillion earlier this year and is still climbing — and the more diagnostic number isn’t the level, it’s the rate of change, which has only been matched three times since 1997: late 1999 into 2000, mid-2007, and spring 2021. You know how each of those stories ends. Leveraged ETF assets hit roughly $220 billion in the first half of 2026. Add options gamma, equity repo, and an estimated 60% of trading volume running through algorithms, and you have a forced-selling machine that is functionally the direct descendant of 1929’s margin-call cascade — different instruments, same reflexivity.
Then there’s the layer 1929 didn’t have: corporate credit. Hyperscaler capital expenditure estimates for 2026 have been revised up from roughly $650 billion to $725 billion, with Moody’s projecting $785 billion this year and a trillion in 2027 — increasingly debt-financed, with Amazon’s reported $25 billion debt sale being one visible marker. Layer onto that the circular vendor-financing pattern where AI companies invest in each other’s products and book the resulting revenue, some of which may not reflect real end demand. Enterprise AI software revenue currently covers less than half of the infrastructure spend it’s supposed to justify. This is this era’s version of the investment-trust pyramid — not fraudulent, but structurally dependent on a monetization curve that hasn’t shown up yet.
Trade. 2025 brought sharp, broad U.S. tariff increases applied to allies and rivals alike, with more volatility running through 2026. The WTO has cut its 2026 global trade growth forecast to 0.5%, down from 1.8%, and warns that a full U.S.-China decoupling could shave roughly 7% off long-run global output. UNCTAD projects 2.6% global growth this year, with U.S. growth slowing toward 1.5%. Here’s the structurally interesting part: the Smoot-Hawley-style shock has arrived before any crash this time, not after one — and markets have, so far, absorbed it. Whether that means the damage is priced in or merely deferred is one of the live questions this whole framework is built to answer.
Geopolitics. The backdrop is simply hotter than 1929’s. U.S.-China strategic decoupling keeps deepening. Iran was signaling potential Red Sea disruption in the very week I was writing this, moving equity indices intraday. Tariffs are being wielded against allies — Japan, the EU, Canada, Mexico — as general-purpose statecraft, and the multilateral guardrails, the WTO’s dispute mechanism chief among them, are functionally degraded. In 1929, the geopolitical deterioration followed the economic collapse by years. In 2026, it’s running concurrently — which removes a buffer the interwar sequence actually had.
Side by Side
Laid out variable by variable, here’s how it scores:
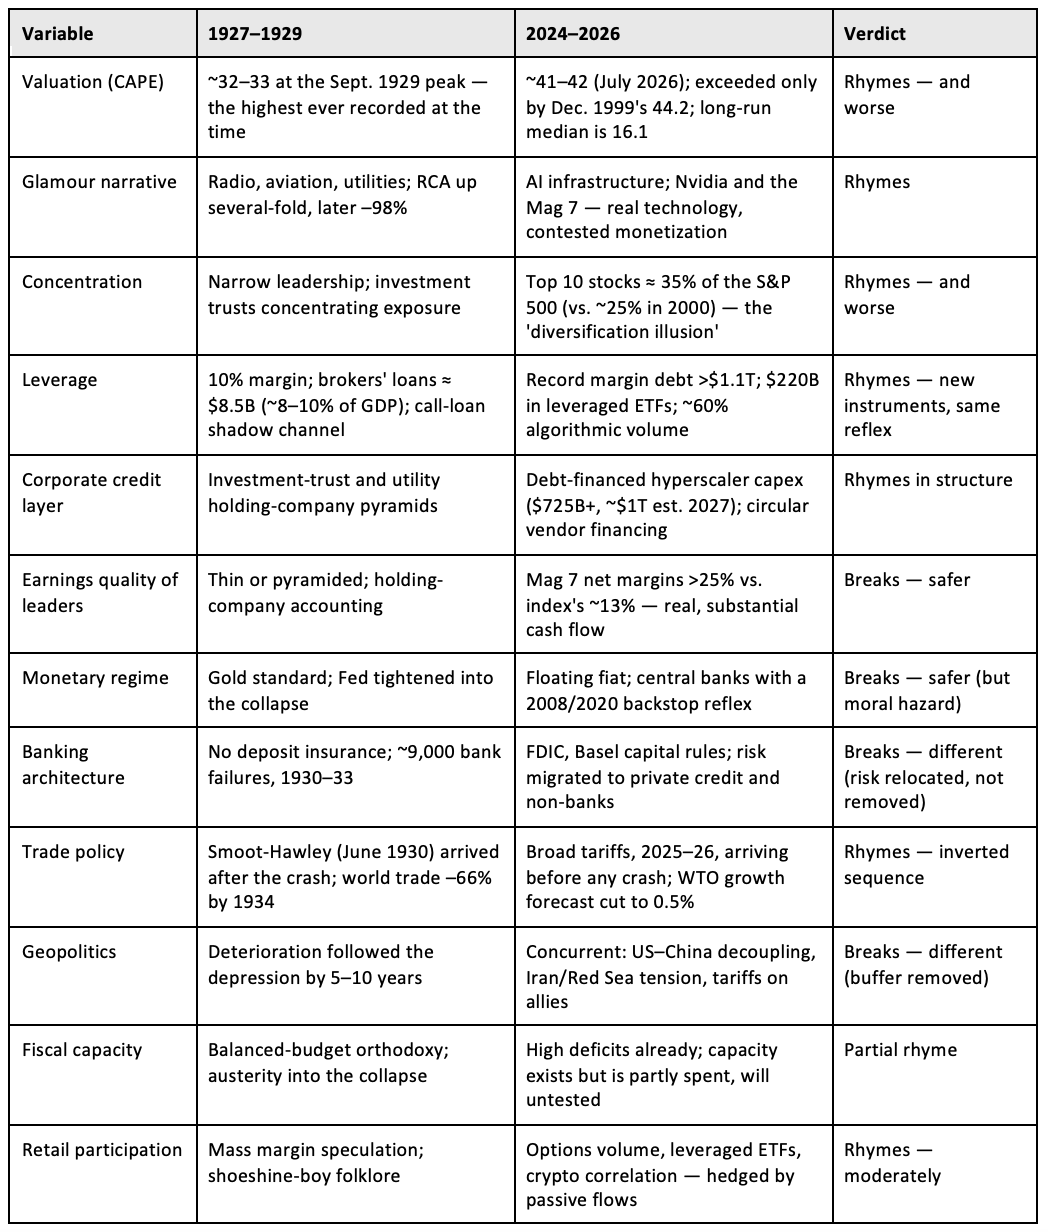
Read plainly: the pre-conditions rhyme hard — valuation, concentration, leverage, narrative, protectionism. The propagation machinery does not: no gold standard, no uninsured banking system, a central bank that acts fast rather than standing aside. 1929’s outcome required both the bubble and the policy failure. 2026 unmistakably has the first. The second remains a choice nobody has made yet. That asymmetry is the entire basis for the scenario weights further down.
Where the Comparison Breaks Down
Three real disanalogies do most of the work here, and any honest version of this comparison has to carry all of them.
• The policy reflex is inverted. The 1929–33 Fed tightened into a collapse and let a third of the money supply disappear. The post-2008 institutional instinct is the opposite — if anything, too quick to backstop. That truncates the ugly left tail: an 89%-style wipeout requires the state to stand aside for three years, and that is simply not the modern revealed preference. The cost of that reflex is chronic moral hazard and asset-price inflation — which is partly how CAPE got to 42 in the first place. The safety net and the bubble are, in an uncomfortable way, the same mechanism viewed from opposite ends.
• The leaders actually earn money. RCA in 1929 and Pets.com in 2000 were priced on futures with no cash flow behind them. Today’s leaders generate enormous free cash flow at 25%-plus net margins. That narrows the bubble question considerably: it’s not ‘are these real businesses,’ it’s ‘can $725 billion to a trillion dollars a year of infrastructure spending get monetized before the debt funding it reprices.’ A miss produces a violent sectoral repricing — the 2000 template — rather than an economy-wide solvency crisis on its own.
• There’s no gold standard. The interwar depression went global because fixed exchange rates forced synchronized deflation onto every country defending its parity. Floating currencies and independent central banks mean a 2026 shock would propagate through credit spreads, the dollar, and trade volumes instead — faster in transmission, but with more policy degrees of freedom at every node along the way.
And one thing cuts the other way. In 1929 the geopolitical order was intact when the crash hit, and the decade still ended in world war. In 2026 the trade war and the security deterioration are already running before any financial rupture has even happened. If a major correction does arrive into an environment of tariff walls, degraded institutions, and live conflict risk, the interwar sequence compresses — the financial and political feedback loops start operating simultaneously instead of one after the other.
The Centerpiece: Private Credit as the New Call-Loan Market
If there’s one place I’d tell you to actually focus, it’s this section. An earlier pass at this framework flagged private credit as its weakest data point — an analogy resting mostly on the fact that the sector is opaque, which is not the same thing as evidence. That’s no longer an honest description. As of the first half of 2026, the channel is producing observable, dateable stress signals, which upgrades this comparison from metaphor to live evidence.
Size first. U.S. private credit crossed $2 trillion in assets under management during 2025, with the Fed’s own May 2026 Financial Stability Report sizing it conservatively at $1.5 to $2 trillion; Preqin projects $2.64 trillion by 2029. For scale: brokers’ loans at the 1929 peak ran roughly 8 to 10% of GDP. Private credit today runs roughly 5 to 7% of U.S. GDP — the same order of magnitude. The retail-facing, semi-liquid wrapper for a lot of this — business development companies, or BDCs, with quarterly redemption windows sitting on illiquid loan books — had accumulated roughly $530 billion globally heading into this year. The fastest-growing corner of the whole asset class, at roughly 13% of strategies, is NAV financing: lending against the marked value of private fund portfolios. Leverage, collateralized by model-derived valuations of other leverage.
The structural mapping to 1929 is close enough to be uncomfortable. In both eras, this is the dominant non-bank funding channel — for levered equity then, for levered corporates now. In both eras, the funding source has no relationship reason to stay: corporations and foreign lenders chasing call rates in 1929, retail and semi-liquid capital in quarterly-redemption wrappers today. Where it diverges is pricing visibility and speed. The call-loan market was transparent and instantaneous — everyone could watch the run happen in real time in October 1929. Private credit is opaque and gated — loans marked to model quarterly, with public proxies like BDC share prices actively disputing those marks. And where 1929’s call loans were callable on demand and evaporated within days, today’s redemptions are capped at roughly 5% per quarter by fund structure — converting a potential run into a slow bleed instead of an instant collapse, at the cost of a refinancing freeze for whoever’s on the other side of that loan.
Which failure mode is actually worse is genuinely unresolved. 1929’s was violent and visible. The modern version risks a long period where nobody — including the lenders themselves — knows the true size of the hole.
And the 2026 stress record is no longer hypothetical. Average redemptions from perpetual non-traded BDCs jumped from 1.6% of net asset value in the third quarter of 2025 to 4.8% in the fourth, with requests exceeding the standard 5% quarterly caps starting in early 2026. Blue Owl’s funds saw exit requests reported at 41% and 22% and imposed gates in April; the associated merger of its non-traded BDC into its listed vehicle — done at NAV, while the listed vehicle traded at roughly a 20% discount to that same NAV — drew a class-action suit alleging the redemption pressure had been downplayed. The public BDC index has traded at roughly a 17% discount to stated NAV through the first half of 2026, matching the trough seen in June 2022, with several individual vehicles down more than 30% year to date. That 17-to-20% gap is about the closest thing this market has to a real price signal: the public market voting, every single day, that the private marks are wrong by roughly that much. The gap between mark and market is the opacity, quantified.
Headline default rates in private credit have stayed under 2%, but analyses that account for selective defaults and liability-management maneuvering put the true rate closer to 5%. Payment-in-kind interest — borrowers paying what they owe with more debt rather than cash — has climbed to roughly 8% of public BDC investment income. PIK is the tell worth watching here: it’s how deterioration gets deferred instead of recognized, the modern equivalent of 1929’s pyramided paper returns. And BDCs face roughly $12.7 billion in 2026 debt maturities, up 73% from last year, arriving into a market where private debt issuance is down about 25% year over year through May.
Now, the honest counter-case, because it’s substantial. Fitch’s review of the rated perpetual non-traded BDCs found average leverage of 0.71x — versus 1.13x for other rated BDCs — and asset-coverage cushions averaging 38.6%, which is not, in their words, the balance sheet profile of a sector in crisis. Portfolio underperformance to date looks largely idiosyncratic rather than systemic. J.P. Morgan notes that alternative-manager equity multiples are sitting near historical troughs already, suggesting meaningful pain may already be priced in. And the modern channel has something the call-loan market never had: roughly $1.5 trillion of perpetual capital sitting with five major alternative-asset managers who have an existential incentive to defend the asset class. The gates themselves are a genuine firebreak 1929 lacked — a run legally capped at 5% a quarter cannot cascade in a week the way call loans did.
But that firebreak has a cost that routes straight back into the real economy: gated capital is capital that stops originating new loans. If the semi-liquid wrapper freezes up, the stress doesn’t transmit through lender insolvency the way it did in 1929 — it transmits through a refinancing drought for the mid-market borrowers, and increasingly the data-center projects, that came to depend on this channel. The AI capex debt from earlier in this piece and the redemption mechanics here are the same risk, viewed from opposite ends of the same pipe.
The fair reading, as of mid-2026: the first pylons of a bridge from sectoral stress to something more systemic — gating, mark disputes, PIK accumulation — became visible in the first half of this year, and so far, they were contained. Contained early stress is evidence for two things at once. It proves the transmission channel is real. And it proves the firebreaks function under moderate load. What it cannot tell you is how those firebreaks hold up under real load. The one narrow, specific lesson from 1929 worth carrying forward: watch the funding channel with the least loyal capital and the least visible pricing, because that’s where every leveraged era’s reckoning has started.
Three Ways This Plays Out
None of the above tells you what happens next by itself — it just tells you what’s true right now. Here are three ways it could go, with rough, qualitative weights attached for framing rather than forecasting. Worth saying up front: CAPE has no timing power on its own. It sat elevated for years before both 1929 and 2000 finally broke, and the steepest gains in any mania tend to come in the final stretch before it does.
Scenario A — The Melt-Up Extension (roughly 30–35%)
This is 1927, not 1929. AI monetization arrives fast enough to keep the capex flywheel credible. Rate cuts continue into non-recessionary growth. The Nasdaq’s roughly 88% five-year gain — modest next to the dot-com era’s twelvefold run — gets read correctly as mid-cycle rather than terminal. Equal-weight indices finally start participating, broadening the rally out. CAPE pushes past the 1999 record of 44.2. Tariff regimes settle into negotiated stability, with the June 2026 Canada-Mexico reductions to 15% as the template. This scenario needs enterprise AI revenue growth visibly closing the gap on infrastructure spend, credit spreads staying tight, and no energy or shipping shock out of the Gulf.
Scenario B — The Sectoral Unwind, 2000 Template (roughly 40–50%, the base case)
The monetization gap becomes undeniable. Hyperscaler capex guidance gets cut, circular vendor-financing revenue gets re-marked, and the AI complex reprices somewhere between 40 and 60% while the broader economy avoids systemic collapse. The S&P falls 25 to 40% simply because the index is the AI complex now — that 35% concentration doing its work in reverse — but the banking system’s insurance architecture holds and the Fed cuts aggressively. Expect a grinding two-to-three-year bear market in the former leaders, with capital rotating toward cash-flowing assets: hard assets, income-producing real estate, and boring operating businesses outperforming on a relative basis. This needs the credit layer to hold — private credit marking down without tipping into a run, data-center debt getting restructured rather than defaulted en masse.
Scenario C — The Systemic Cascade, 1929 Template (roughly 10–20%)
This is the sectoral unwind above infecting the credit system itself. Private credit — the modern, opaque, uninsured funding channel, the functional heir to 1929’s call-loan market — experiences a run dynamic that overwhelms the quarterly gates; in this reading, the redemption wave already seen at gated Blue Owl vehicles was the overture, not the event. Data-center-backed debt and leveraged-ETF liquidation cascade through non-bank lenders faster than regulators can track it, with the 17-to-20% mark-to-market gap resolving abruptly in the marks’ disfavor. This scenario requires a conjunction, not a single failure: simultaneously, a geopolitical shock — a Gulf closure and oil spike, a Taiwan event, a disorderly U.S.-China financial break — arrives into the drawdown, and the policy response is hobbled by fiscal exhaustion and political fragmentation. Equities fall 50 to 65%. The recession is deep and global. Trade contraction accelerates toward interwar patterns.
This is the compressed version of the interwar sequence — protectionism to bloc formation to security crisis — running over two to four years instead of ten. Hold that reading with real suspicion, precisely because it’s the most narratively satisfying one. Single failures lead to Scenario B, not C. It takes at least two independent breaks at once — credit contagion plus a geopolitical shock plus a policy stumble — to get here, which is exactly why it’s a tail risk and not the base case, despite how much the surface resembles 1929.
What Would Prove Me Wrong
A framework that can’t be falsified isn’t a framework, it’s a narrative wearing a lab coat. Here’s what I’m actually watching, and what each signal would mean:
• Hyperscaler earnings calls, specifically AI software revenue against capex guidance. A closing gap points toward A. The first major guide-down in capex is the single most reliable trigger for B.
• Margin debt’s rate of change, not its level. Deceleration after a record-pace run has preceded every major market top since 1997.
• The BDC price-to-NAV discount against the roughly 17% trough, plus redemption requests against the 5% quarterly caps, plus PIK share of BDC income against its roughly 8% baseline. Requests normalizing under the cap is B-compatible; gating spreading across managers with PIK climbing is the loudest signal in this entire piece for C.
• Private debt issuance and the BDC maturity wall — $12.7 billion due this year, up 73%. Clean refinancings, even at a worse rate, mean the channel is functioning. Extensions, PIK conversions, and amend-and-extend clusters mean the freeze is transmitting to borrowers.
• Equal-weight versus cap-weight S&P performance. Broadening favors A. Narrowing into new highs is the late-stage mania pattern from both 1929 and 1999’s final year.
• The first restatement or write-down of circular AI vendor-financing revenue — the closest thing this cycle has to an ‘Insull moment,’ the pyramid becoming visible to everyone at once.
• Trade volumes against the WTO and UNCTAD forecasts. Undershooting an already-cut forecast means tariff damage is compounding. Stabilization is A-compatible.
• How U.S. tariff policy responds to the first 10%-plus equity drawdown. Easing into weakness means the lesson got learned. Raising them is the 1930 reflex completing itself in real time, and the single loudest signal for C in the whole dashboard.
• Energy and shipping: Strait of Hormuz and Red Sea transit volumes, oil term structure. A sustained spike into an equity drawdown is the conjunction Scenario C actually requires.
• Where the first real credit casualty sits. Inside the insured banking perimeter, it’s manageable. A run on the non-bank, private-credit channel is the call-loan analogue completing itself.
What It Means If You’re Not Trading the S&P
Most of us reading this aren’t running index portfolios — we’re running or advising businesses whose exposure comes through interest rates, credit availability, cap rates, and local demand, not ticker symbols. So translate the three scenarios that way.
Under the melt-up (A), rates drift lower slowly, credit stays available, and cap-rate compression continues — good for sellers, and it makes disciplined acquisition criteria (a fixed cap-rate floor, conservative leverage) feel expensive right up until it doesn’t. The real risk here is thesis creep: loosening your own standards because everything around you is trading rich.
Under the sectoral unwind (B), which is the base case, this has historically been the most interesting environment for anyone holding cash-flowing hard assets. Policy rates fall meaningfully. Banks tighten on speculative credit but keep lending against seasoned income streams. Distressed and motivated-seller inventory tends to show up 12 to 24 months into the downturn. Fixed-rate term debt locked in before the turn becomes an asset in its own right. Demand for storage is historically counter-cyclical — dislocation drives usage — while discretionary spend on things like landscaping softens.
Under the cascade (C), credit availability, not price, becomes the binding constraint. The actual 1930s lesson is that unleveraged owners of essential-service assets survived and consolidated, while leveraged owners of the identical assets did not. Covenant headroom and refinancing calendars end up mattering more than cap rates.
Across all three, the same conclusion holds: this argues for stress-testing your existing and pending debt structures against a credit-contraction scenario, not just a rate scenario. Those are genuinely different tests, and 1929’s actual damage ran through the first one, not the second. None of this is advice on any specific facility or position — that conversation belongs with people who have your full balance sheet in front of them and a license to talk about it.
So, Is It 1929?
Wrong question, same as it was at the top. The honest answer is that the pre-conditions rhyme about as hard as they possibly could — valuation, concentration, leverage, the glamour narrative, even the tariff shock. What doesn’t rhyme is the machinery that turns a bubble into a depression: no gold standard, an insured banking system, a central bank that moves fast instead of standing aside. 1929 needed both the bubble and the policy failure to become 1929. We’ve got the first. Nobody’s made the second choice yet — and the entire point of writing this down, in public, with a dashboard attached, is that you don’t get to find out we were wrong from me quietly changing my mind later. You get to watch the same indicators I am.
Structure before sophistication. Every time.
A note on sources: 2026 figures are drawn from data current to mid-July — the Shiller/Multpl CAPE series, Apollo Global Management commentary, Moody’s hyperscaler capex estimates, WTO/UNCTAD trade forecasts, Federal Reserve and Preqin private-credit sizing, Fitch’s BDC ratings review, and contemporaneous financial press. Historical figures for 1927–1932 come from Robert Shiller’s reconstructed dataset, Friedman and Schwartz’s A Monetary History of the United States, and standard economic-history estimates. This is an analytical scaffold, not investment, legal, or tax advice, and nothing here should be traded on without independent verification.